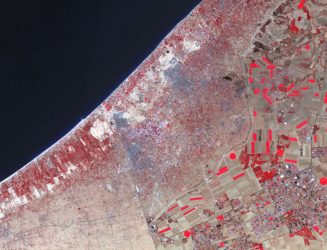
Pictured above: The cross-border region covering Egypt, Gaza and southwest Israel. Here, red regions typically correspond to healthy farmland or trees. Landsat-8 satellite image courtesy of Jamon Van Den Hoek
To explore the causes of social conflict, Jamon Van Den Hoek suggests stepping back to look at the problem from a distance — quite literally.
While most researchers draw from satellite images, many orbiting 400 miles overhead, to tell larger stories of climate change and deforestation, Van Den Hoek sees a treasure trove with a wealth of information to analyze.
“For these big topics like climate change and agriculture that are highly variable across the landscape, every country has a different story to tell,” he says. “But there are satellites up there, and they are all generating images. I thought, ‘What else can we use these for?’ ”

That realization inspired Van Den Hoek, who received degrees from UW–Madison in geography, civil engineering and classical humanities followed by a stint at WID, to continue his career as a NASA postdoctoral research fellow at the NASA Goddard Space Flight Center near Washington D.C.
Working with large databases of satellite imagery, he collaborates with scientists at NASA and universities to map what he calls “conflict ecology,” or an understanding of the relationships between environmental condition and conflict.
Though imagery-based studies aren’t new, his techniques are unique in that he searches for more subtle and long-term environmental changes before and after conflict occurs, while most projects tend to survey abrupt environmental change following a conflict.
Van Den Hoek has provided expertise on several projects, including a collaboration with fellow UW-Madison geography dissertator Tim Wallace and others at the The New York Times to interpret satellite imagery collected before and after July 2014’s conflict in Gaza. The group used satellite images to map the vegetation lost to munitions explosions and troop movements — loss that was distinct from typical vegetation change for the month of July. In many conflicts, information on where military activities are occurring isn’t always accessible because of prohibitive expenses or restrictions from governments. But in this case, mapping change in vegetation is one way to map the conflict’s progression.
“It’s getting at this notion that conflict doesn’t come from nowhere. Often people’s needs aren’t being met because of conflict or because of environmental or climatic change.”
— Jamon Van Den Hoek
Looking at areas currently undergoing transformation, Van Den Hoek says signs that forested or agricultural land is becoming degraded may result from changes in climatic conditions or livelihoods in a given area. But taking a more long-term view that incorporates years of data, he began to see another possibility: land degradation as an indicator of the potential for or consequence of conflict.
“It’s getting at this notion that conflict doesn’t come from nowhere,” Van Den Hoek says. “Often people’s needs aren’t being met because of conflict or because of environmental or climatic change. How can we start changing our stance and start understanding why the world gets into these horrible situations where you have a never ending war, never ending conflict and continued environmental degradation?”
These questions drive him to look at similar satellite image case studies from the last 30 years in northwest Pakistan, the West Bank at the Israel-Palestine border and southern Syria, which he pairs with social data from the United Nations and media coverage, though Van Den Hoek says it’s challenging to visit many of these sites and most data is collected remotely through satellite imagery analysis or meta-analyses of previous studies.
The goal, he says, is to survey the condition of the land and its people. How good is the agriculture? How resilient is it to drought? How do changes in climate and vegetation relate to the potential for conflict?
Van Den Hoek says a true understanding of these issues can only come from leveraging multiple fields of expertise, each with a piece of a solution to give.
“You have to get deeper — you have to talk to urban geographers and you have to talk to sociologists,” he says. “These are the people that can really help contextualize the changes seen in satellite imagery and ideally it would spark some ideas for them too.”
As a recipient of WID’s Emerging Interfaces Award, Van Den Hoek adopted a similar transdisciplinary approach to conduct a pilot study along with UW–Madison professor William Aylward that uses satellite tools to scout excavation potential in the famed archaeological site of Troy in northwestern Turkey.
“When I was working with WID, I was with an incredibly interdisciplinary group of people, and just getting awareness of what other people are doing and recognizing that this can be done is so valuable,” he says. “Beyond my time at UW-Madison, I’m seeking out people that don’t do what I do but have data or methods that are complementary. If we’re interested in questions that we each couldn’t answer alone, working together we can do some pretty cool things.”
— Marianne Spoon


You must be logged in to post a comment.